
How can leveraging sales data boost vending product choices?
Managing vending machine products used to be guesswork. I've seen operators stock machines based on hunches, often leading to wasted inventory and missed opportunities. Sales data changes everything.
Leveraging sales data helps optimize product selection by revealing customer preferences, tracking inventory in real-time, forecasting demand, and enabling dynamic pricing strategies. This data-driven approach leads to better stocking decisions and increased profits.
Let me share how we transformed our vending operations by making data-driven product choices. These insights will help you stock the right products at the right time.
How do you track and analyze vending machine sales data?
When I started, I manually tracked sales with paper records. It was time-consuming and ineffective. Modern tracking systems have revolutionized how we understand customer behavior.
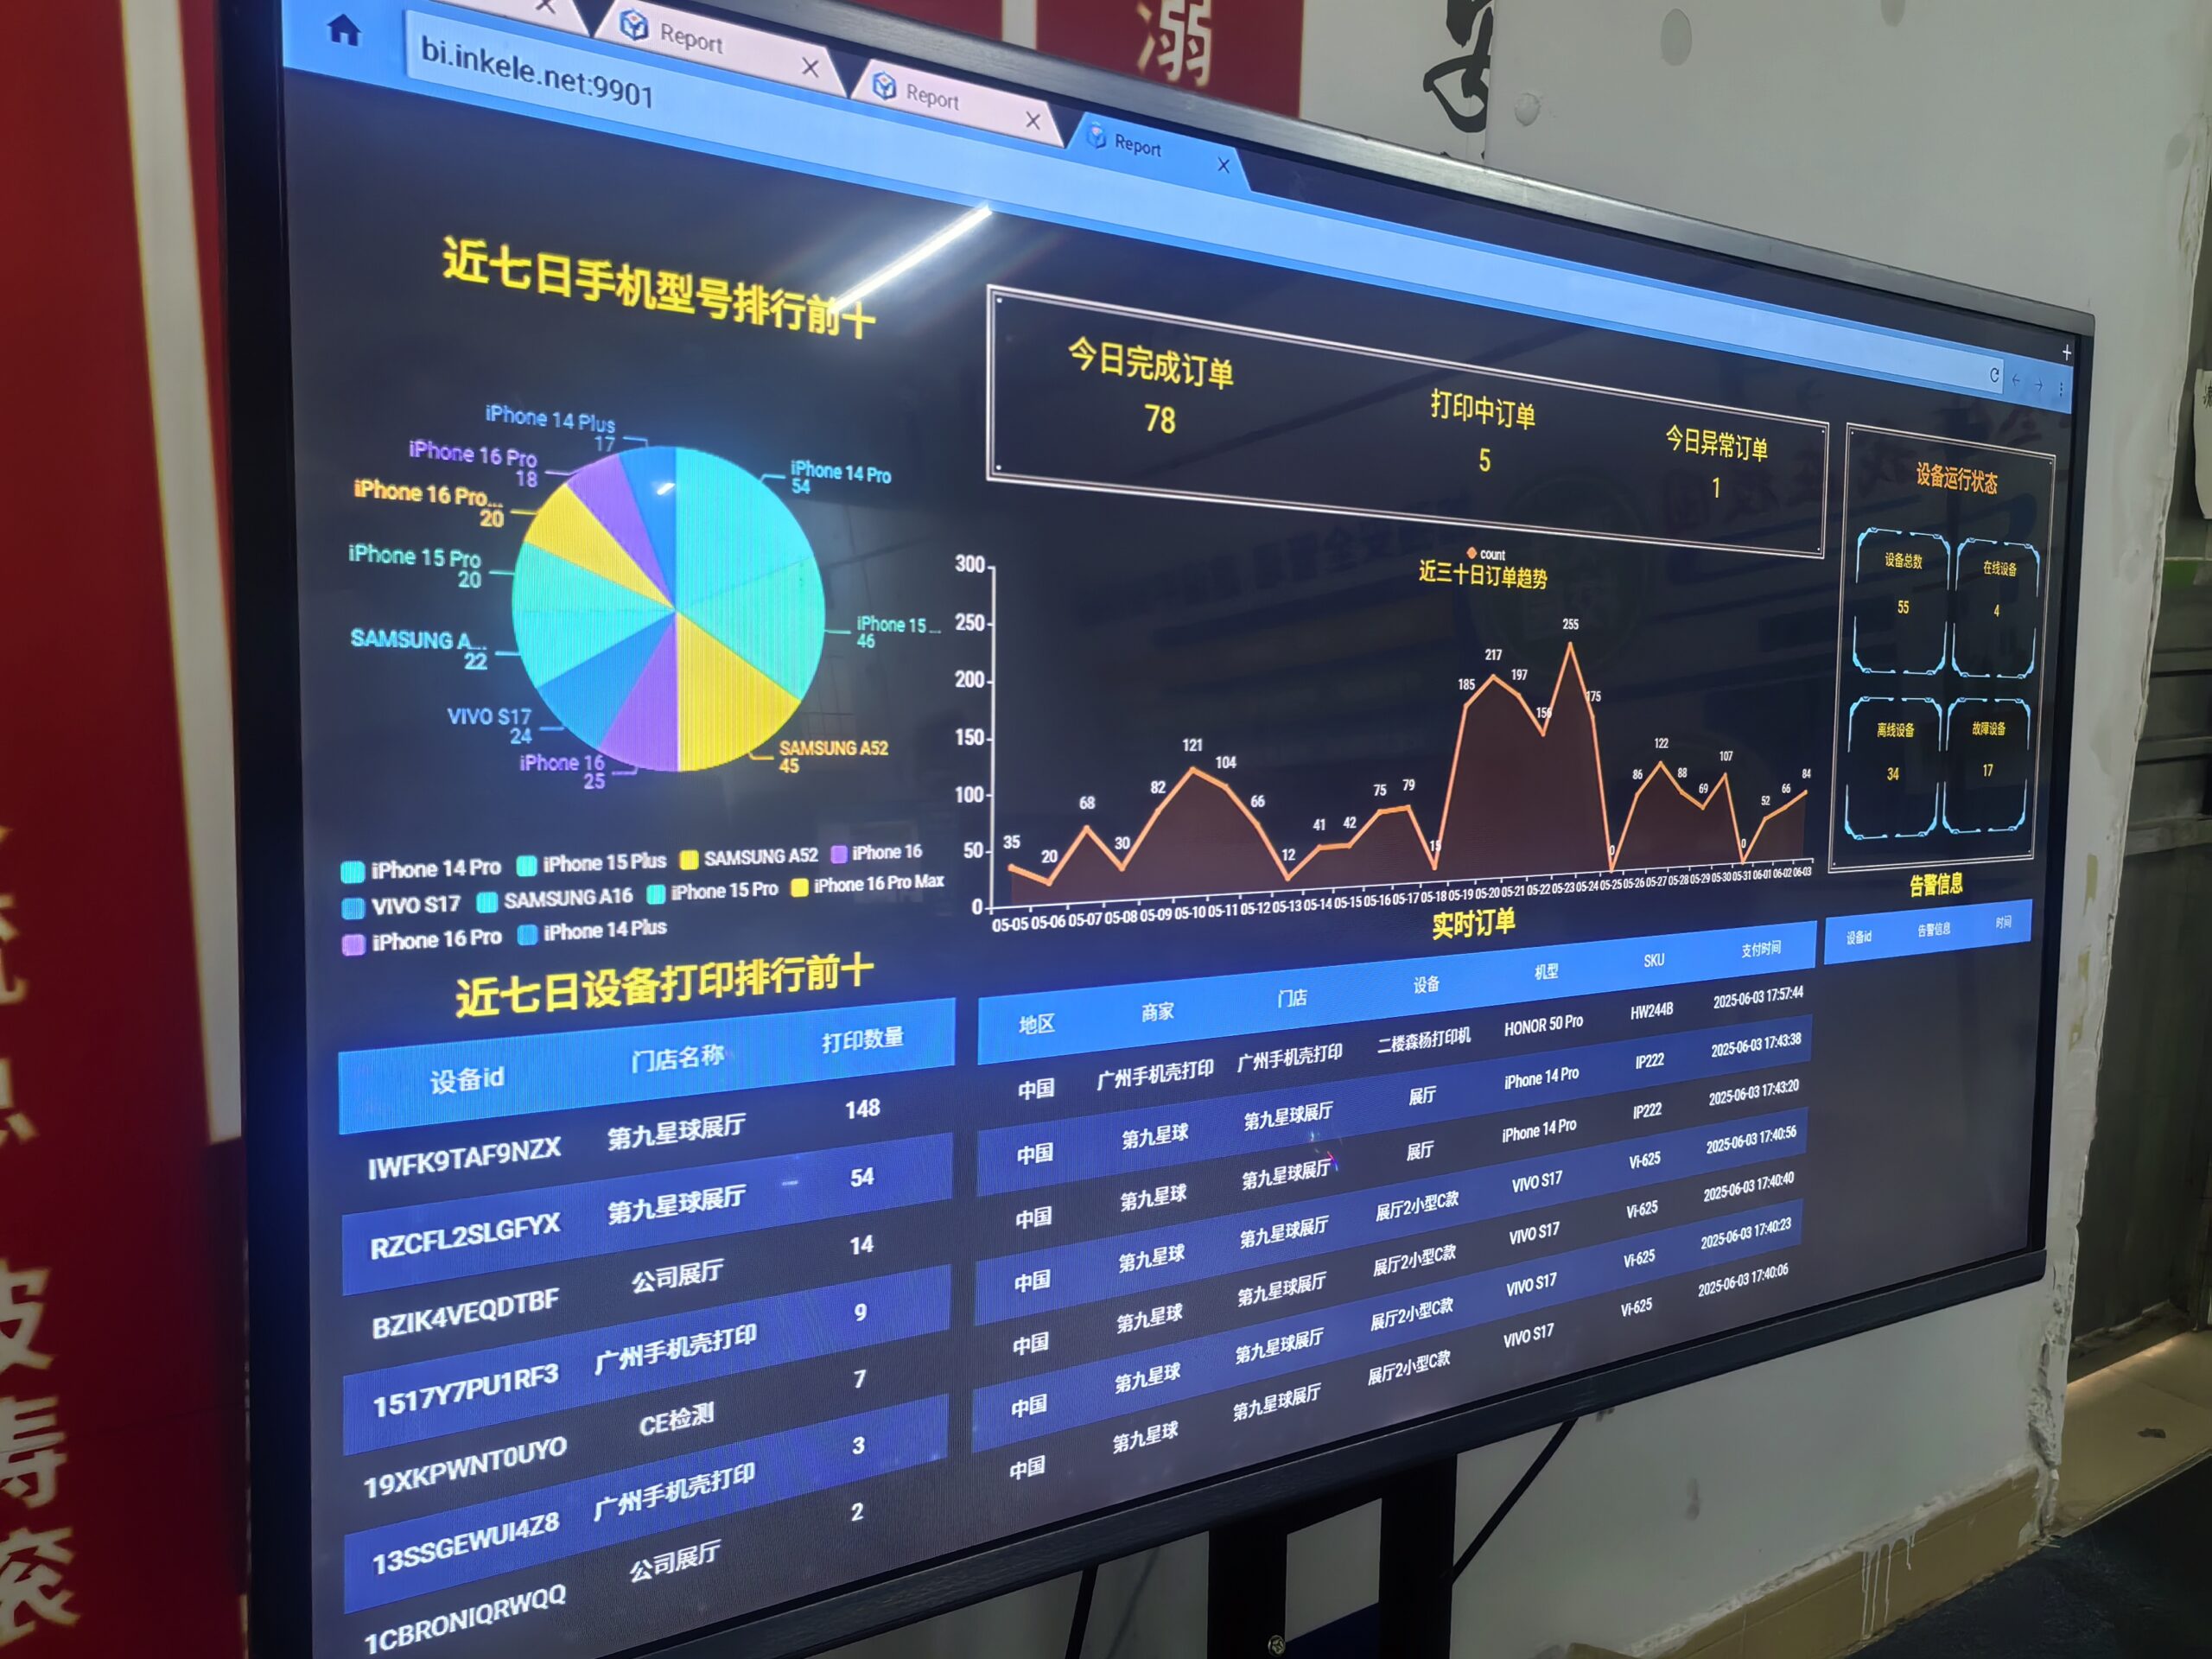
Effective sales tracking requires combining real-time machine data with analytics tools to identify patterns, trends, and opportunities. This helps predict demand and optimize inventory levels across your machine network.

Sales Tracking Deep Dive
Here's how to implement effective sales tracking:
Data Collection Framework
| Data Type | Metrics | Usage |
|---|---|---|
| Transaction Data | Time, date, product, price | Peak hours, popular items |
| Inventory Levels | Stock counts, turnover rates | Reorder timing, waste reduction |
| Payment Methods | Cash vs cashless, average spend | Payment preferences, pricing strategy |
| Location Data | Machine performance by site | Location optimization |
Remember to consider:
- Daily sales patterns
- Weekly trends
- Seasonal variations
- Special event impacts
- Weather correlations
What insights can you gain from customer purchase patterns?
Initially, I thought all vending locations were similar. The data showed each location had unique patterns that required different approaches.
Understanding customer purchase patterns reveals preferences, optimal pricing points, and opportunities for new products. This knowledge helps create targeted offerings that boost sales.

Purchase Pattern Analysis
Let's break down the key insights:
Pattern Recognition Framework
| Pattern Type | Indicators | Action Items |
|---|---|---|
| Time-based | Rush hours, slow periods | Adjust stock timing |
| Product Mix | Popular combinations | Create bundles |
| Price Sensitivity | Sales by price point | Optimize pricing |
| Seasonal Trends | Weather impact | Adjust inventory |
How can you use data for inventory optimization?
My biggest early challenge was balancing stock levels - too much meant waste, too little meant lost sales. Data analysis solved this problem.
Smart inventory management uses sales data to predict demand, reduce waste, and ensure popular items stay in stock. This leads to higher turnover and better profit margins.

Inventory Optimization Strategy
Here's our proven approach:
Inventory Management Framework
| Factor | Analysis Method | Outcome |
|---|---|---|
| Par Levels | Historic sales data | Optimal stock levels |
| Reorder Points | Consumption rates | Reduced stockouts |
| Product Life | Expiration tracking | Minimized waste |
| Demand Forecast | Trend analysis | Improved planning |
How do you implement data-driven pricing strategies?
Price setting used to be simple - match competitors or add a standard markup. Data analysis showed us the power of strategic pricing.
Using sales data for pricing decisions helps maximize profits while maintaining customer satisfaction. Different locations and times may support different price points.

Pricing Strategy Implementation
Understanding pricing through data:
Price Optimization Framework
| Strategy | Data Points | Expected Impact |
|---|---|---|
| Time-based | Peak vs off-peak sales | 10-15% revenue increase |
| Location-based | Demographic data | 15-20% margin improvement |
| Bundle pricing | Common combinations | 20-25% transaction value increase |
| Premium pricing | High-demand items | 25-30% profit boost |
How can you use data for product mix optimization?
Before using data, our product mix was static. Now it's dynamic, changing with customer preferences and seasons.
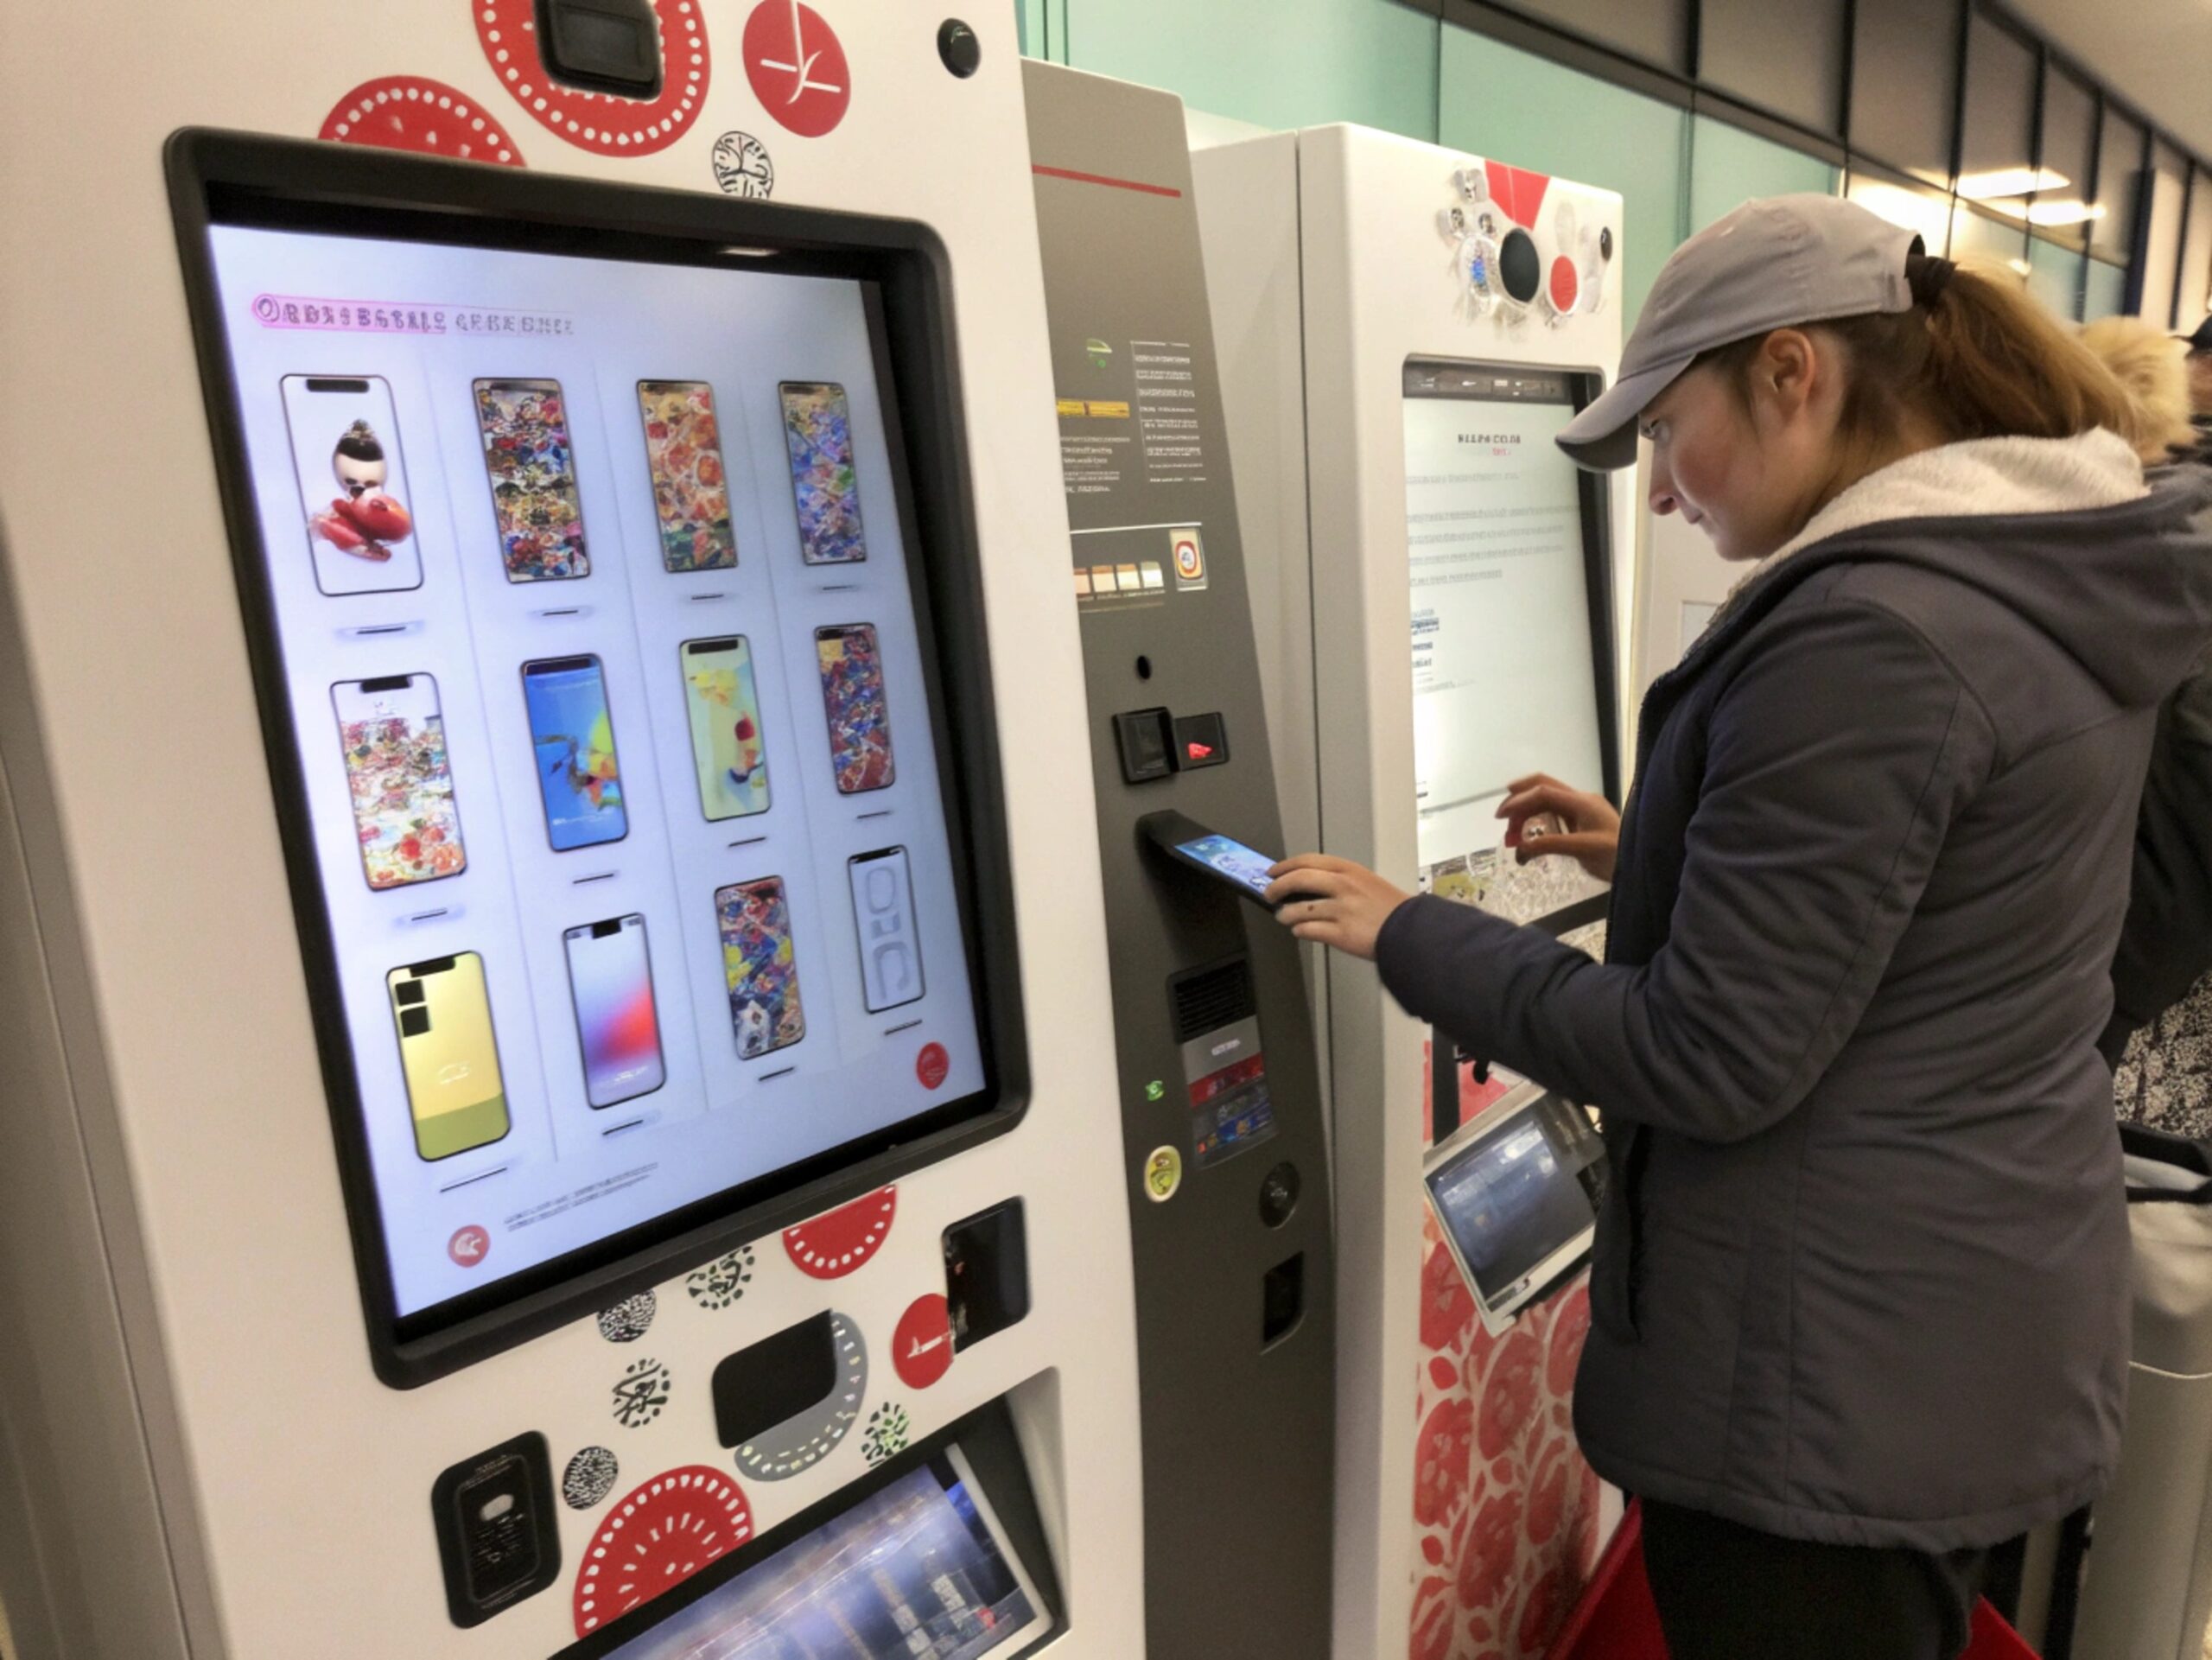
Data-driven product selection ensures your machines stock items customers actually want to buy. This increases turnover and reduces waste from slow-moving inventory.
Product Mix Strategy
Here's how to optimize your product mix:
Product Selection Framework
| Category | Data Points | Stock Level |
|---|---|---|
| Top Sellers | High volume, consistent sales | 40-50% |
| Seasonal Items | Weather-related demand | 20-30% |
| New Products | Market trends, test data | 10-15% |
| Premium Items | Margin contribution | 15-20% |
Leveraging sales data is crucial for optimizing vending machine product choices. By collecting and analyzing transaction data, understanding purchase patterns, optimizing inventory, and implementing data-driven pricing, you can significantly improve your machine's performance. Remember to regularly review and adjust your strategy based on the latest data insights.