
How can customer behavior insights improve vending inventory choices?
I used to stock my vending machines based on gut feeling and general assumptions. The result? Wasted inventory, missed sales opportunities, and disappointed customers who couldn't find what they wanted.
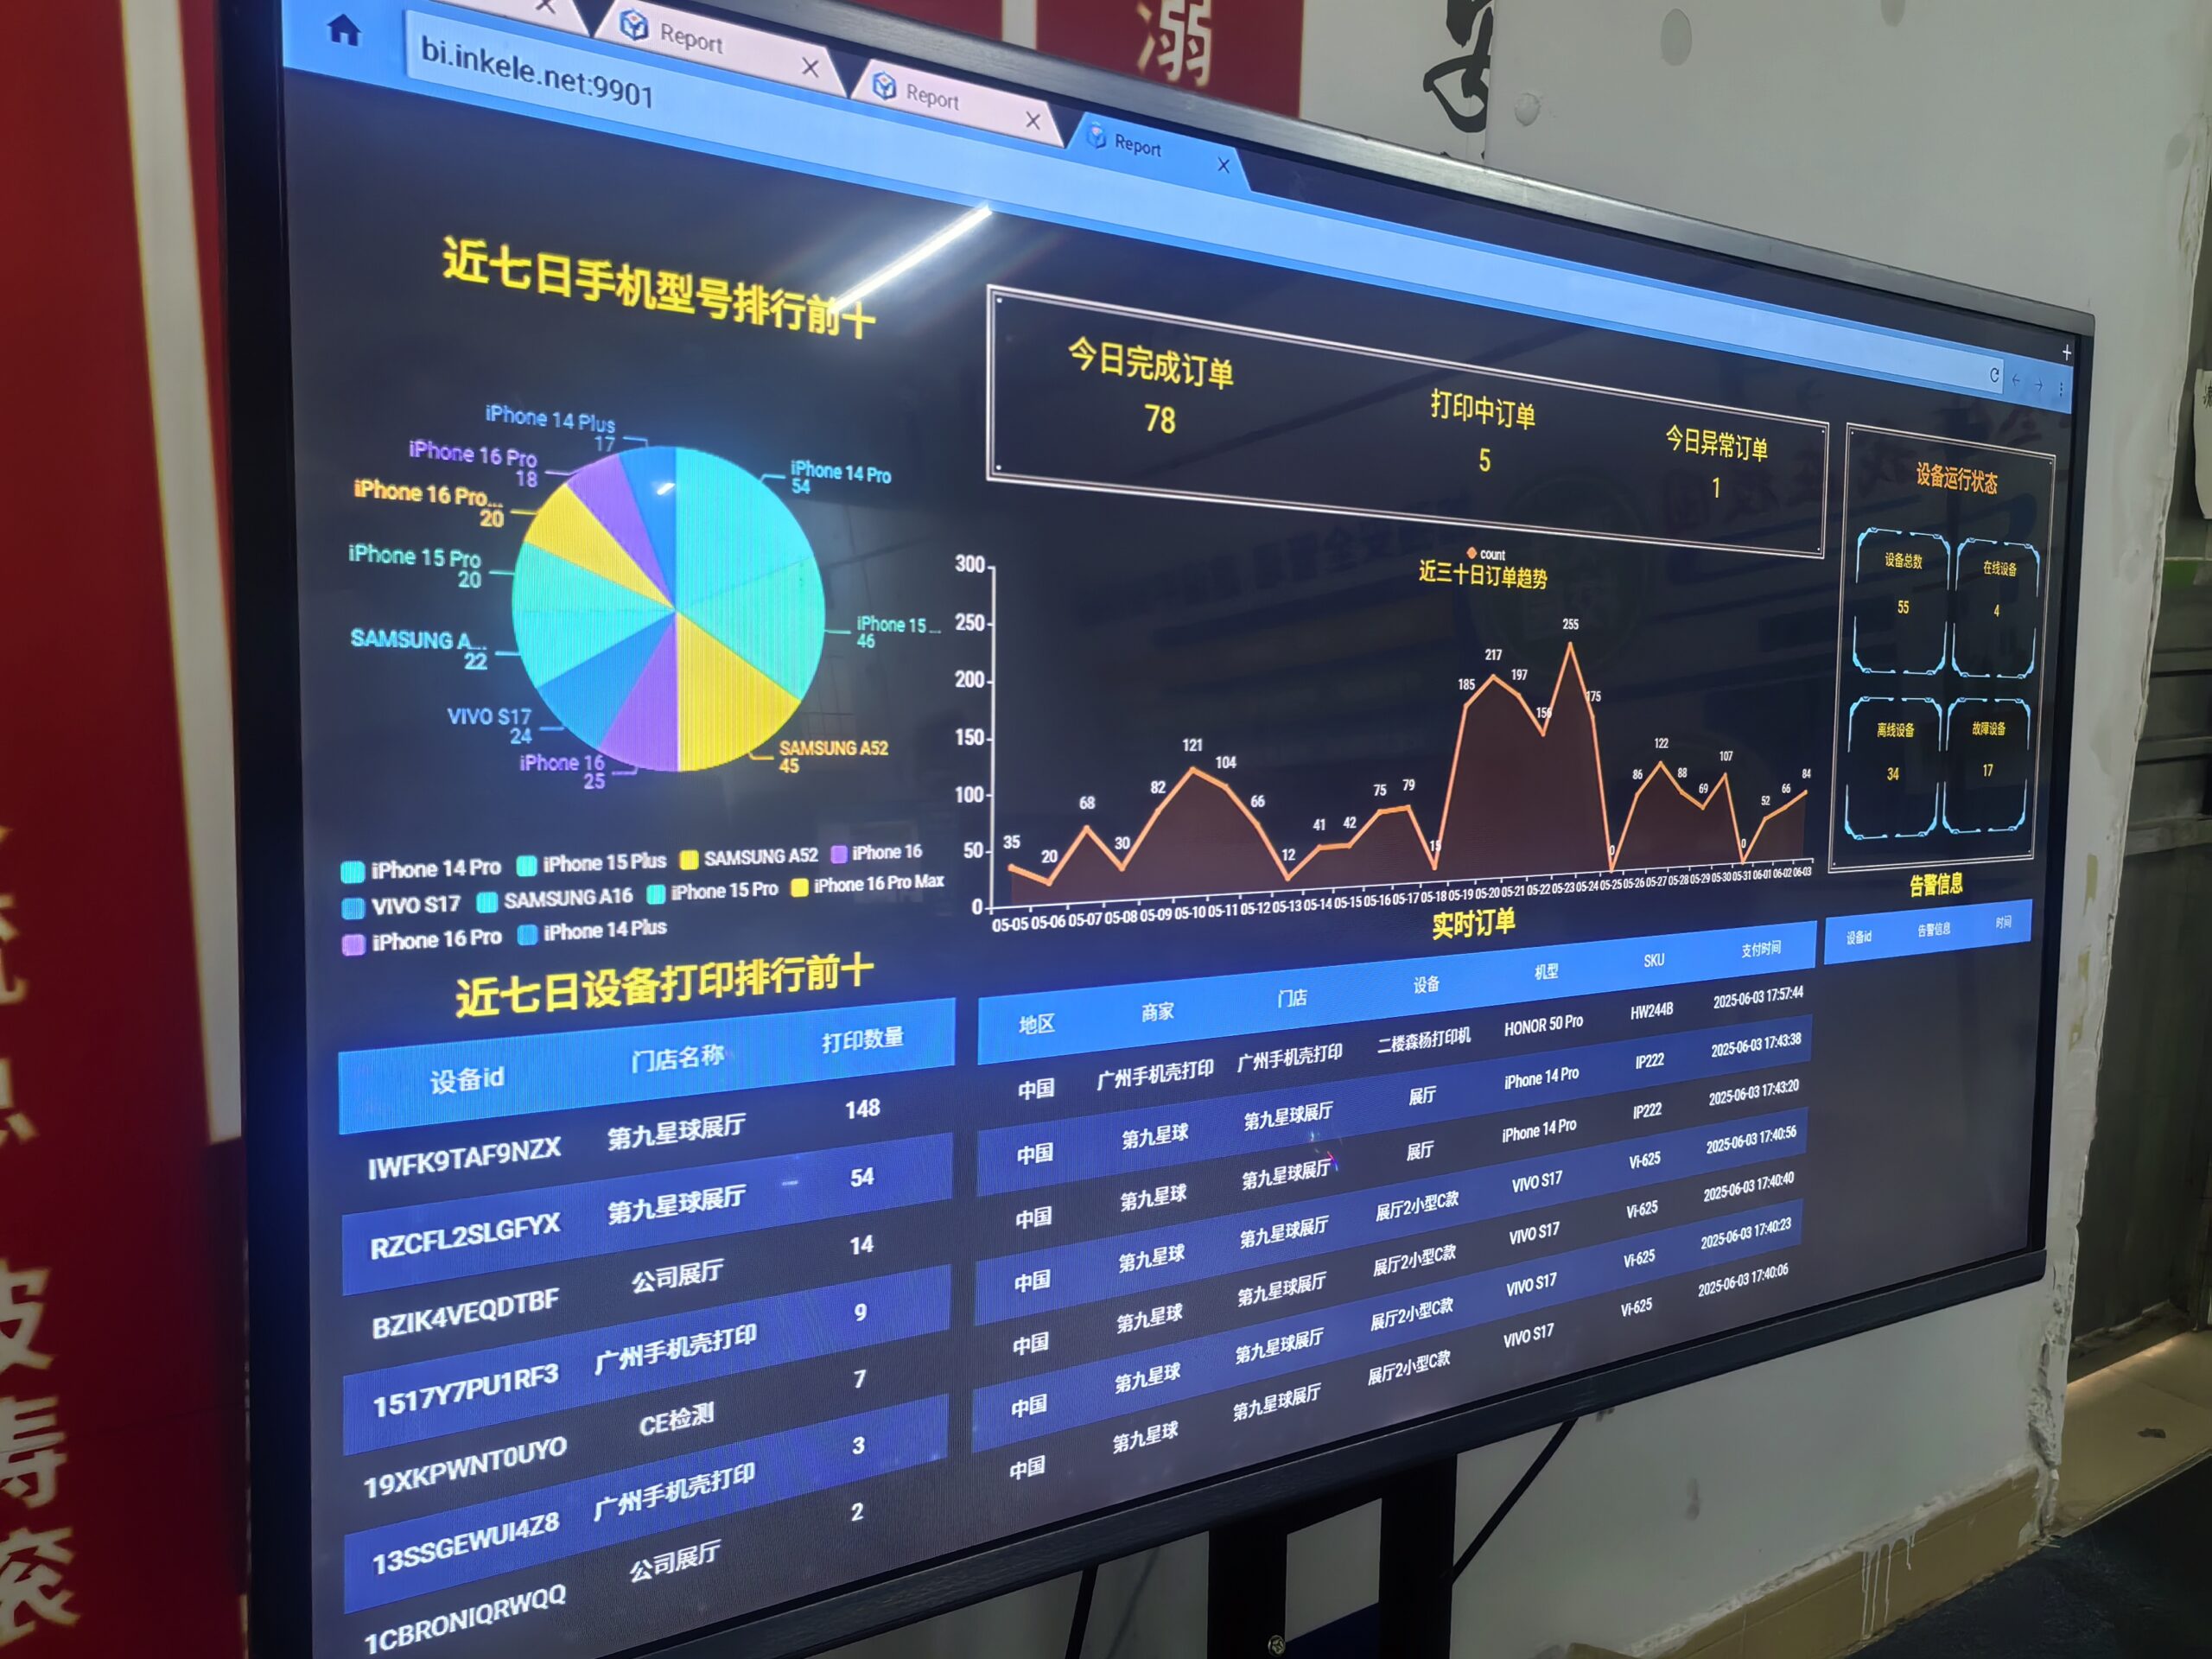
Customer behavior insights help optimize vending inventory by revealing purchase patterns, preferences, and trends. This data enables operators to stock machines with products customers actually want, when they want them.
Let me share how understanding customer behavior transformed our vending operations and can do the same for yours.
How do you identify peak purchase times and patterns?
When I first started, I restocked randomly. Then I noticed some machines would run out of popular items during key times while others had excess inventory that expired.
Peak purchase analysis reveals when customers buy most frequently and what they're buying, allowing for strategic inventory management and targeted restocking schedules.
Peak Time Analysis Strategy
Understanding purchase timing patterns:
Time-Based Purchase Framework
| Time Period | Common Behaviors | Inventory Needs |
|---|---|---|
| Morning Rush | Coffee, breakfast items | High energy options |
| Lunch Hours | Meal replacements, snacks | Diverse food options |
| Afternoon Slump | Energy drinks, sweet snacks | Pick-me-up items |
| Evening Hours | Dinner alternatives, drinks | Substantial options |
Consider these additional factors:
- Day of week variations
- Holiday patterns
- Special event impacts
- Weather influences
- Local schedule changes
How can you adapt to location-specific preferences?
My biggest early mistake was using the same inventory mix everywhere. Different locations have dramatically different customer needs and preferences.
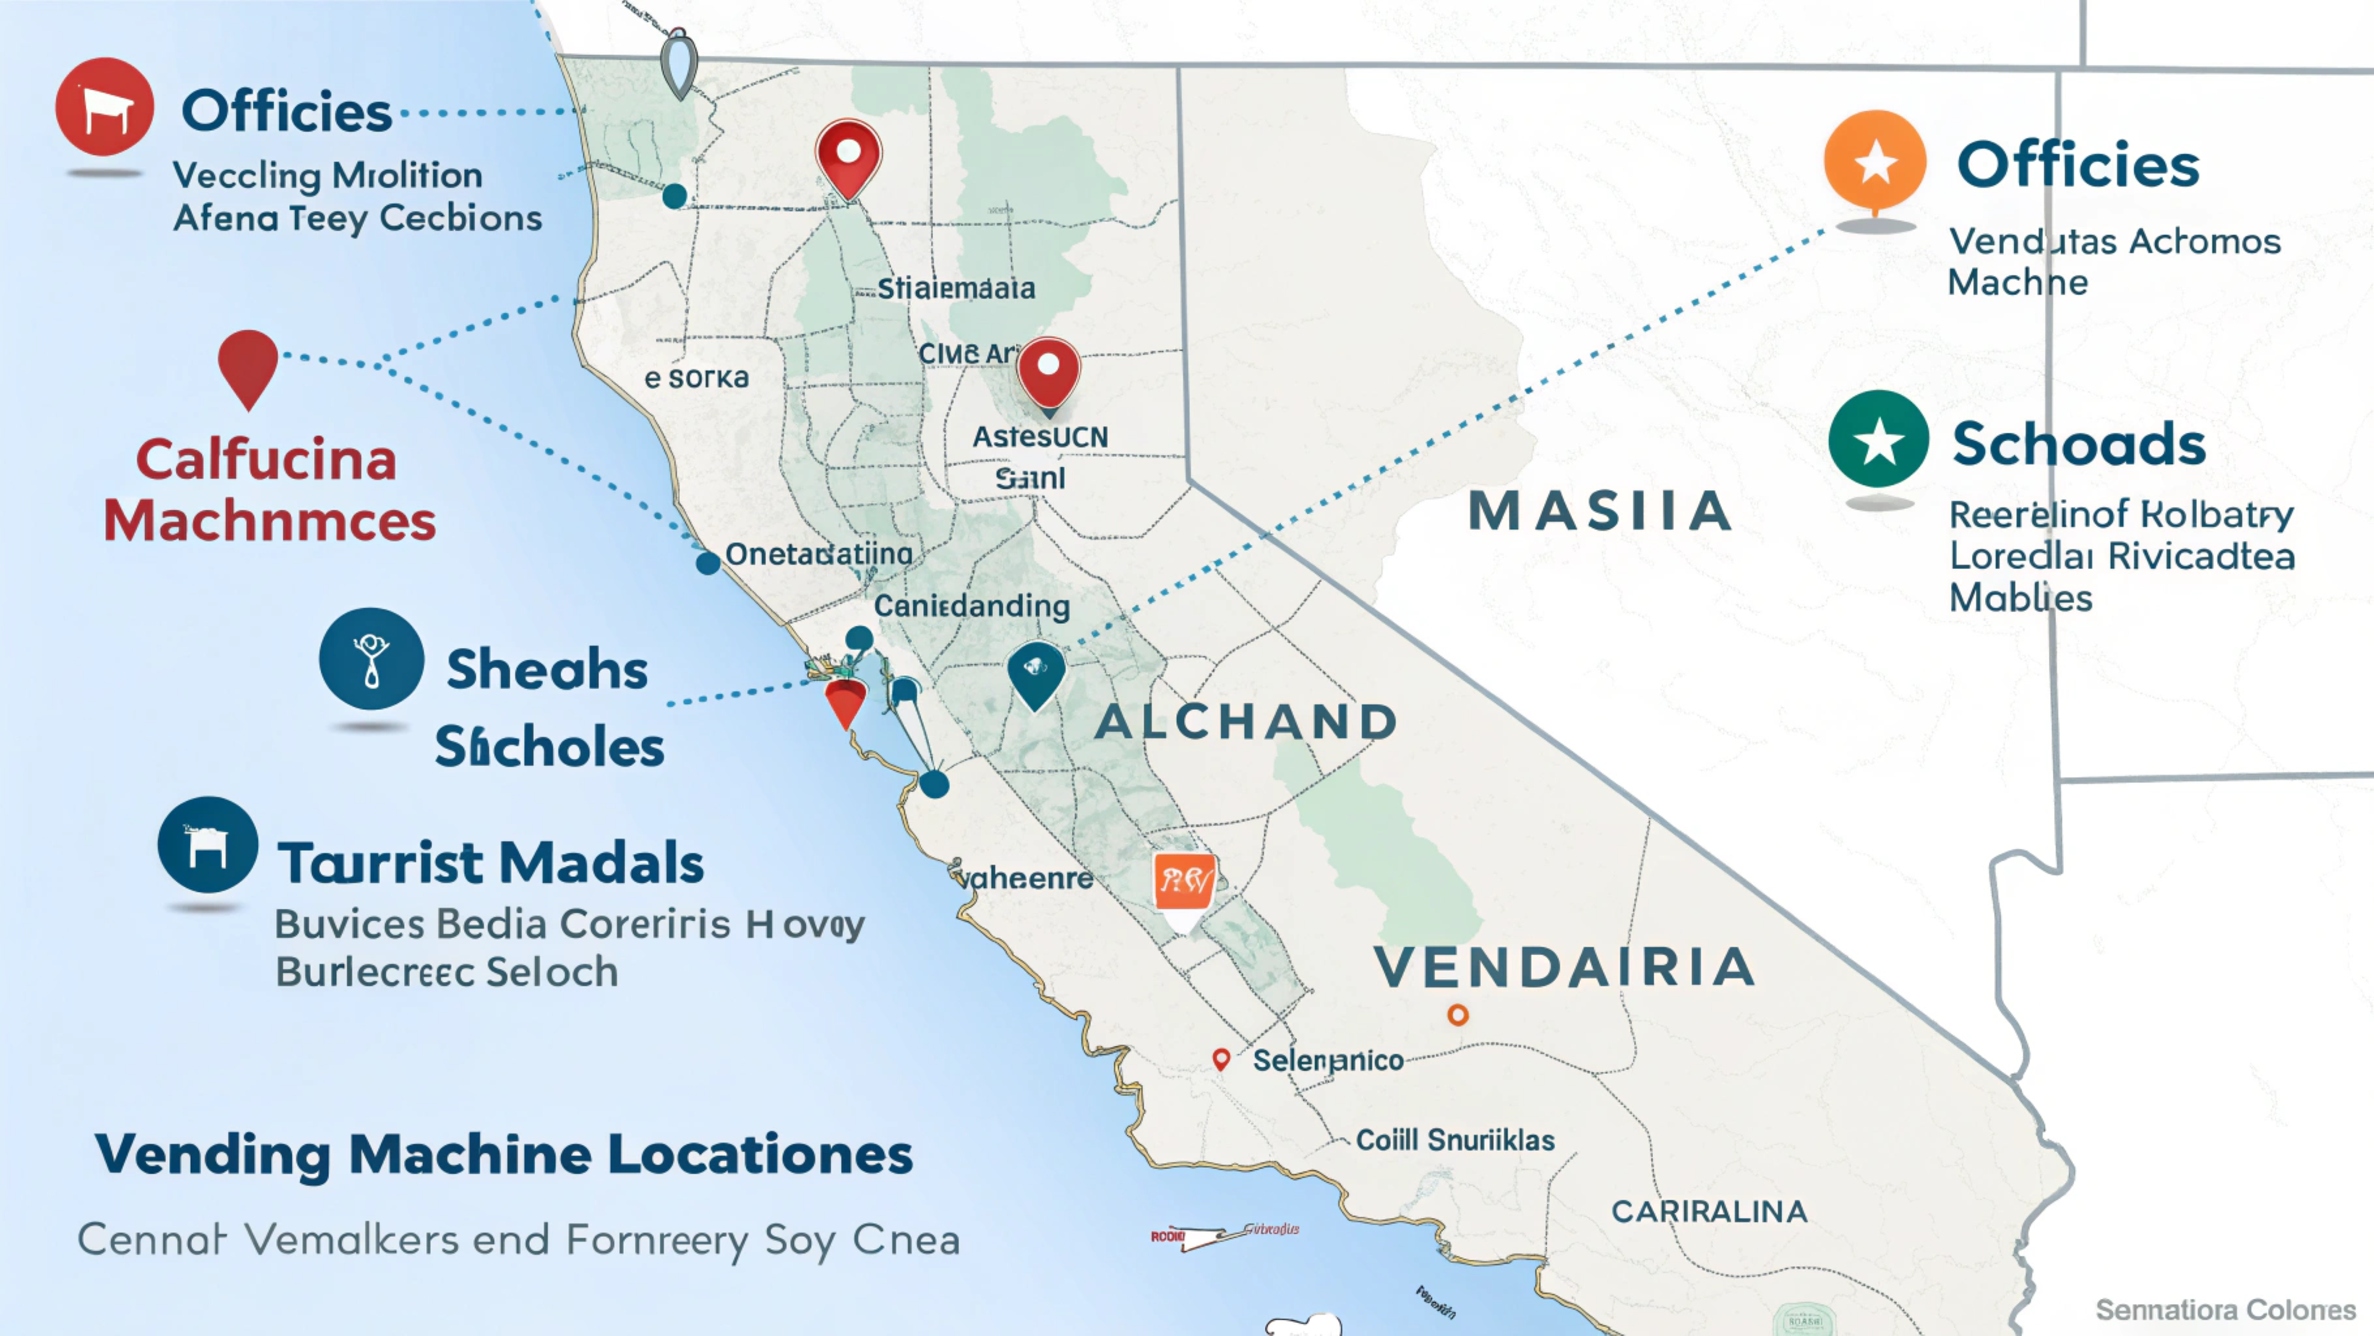
Location-specific behavior analysis helps tailor product selection to local demographics and usage patterns, increasing sales and reducing waste from mismatched inventory.
Location Analysis Deep Dive
Here's how to optimize for different locations:
Location-Based Framework
| Location Type | Customer Profile | Product Focus |
|---|---|---|
| Office Buildings | Professional workers | Healthy snacks, coffee |
| Schools | Students, faculty | Affordable options, energy drinks |
| Gyms | Health-conscious | Protein bars, sports drinks |
| Hospitals | Staff, visitors | 24/7 options, comfort foods |
| Transit Hubs | Travelers | Quick snacks, beverages |
What role do seasonal trends play in inventory choices?
Initially, I maintained the same inventory year-round. Understanding seasonal behavior patterns revealed huge opportunities for targeted inventory adjustment.
Seasonal trend analysis helps predict and prepare for changing customer preferences throughout the year, ensuring your machines stay relevant and profitable.
Seasonal Strategy Implementation
Let's break down seasonal considerations:
Seasonal Behavior Framework
| Season | Customer Needs | Inventory Adjustments |
|---|---|---|
| Summer | Cold drinks, light snacks | Increase refreshing options |
| Winter | Hot drinks, hearty snacks | Add warming choices |
| Spring | Healthy options | Focus on fresh selections |
| Fall | Comfort foods | Include seasonal favorites |
How can predictive analytics improve inventory decisions?
Before using predictive analytics, I was always reacting to inventory problems after they occurred. Now we can anticipate and prevent issues before they happen.
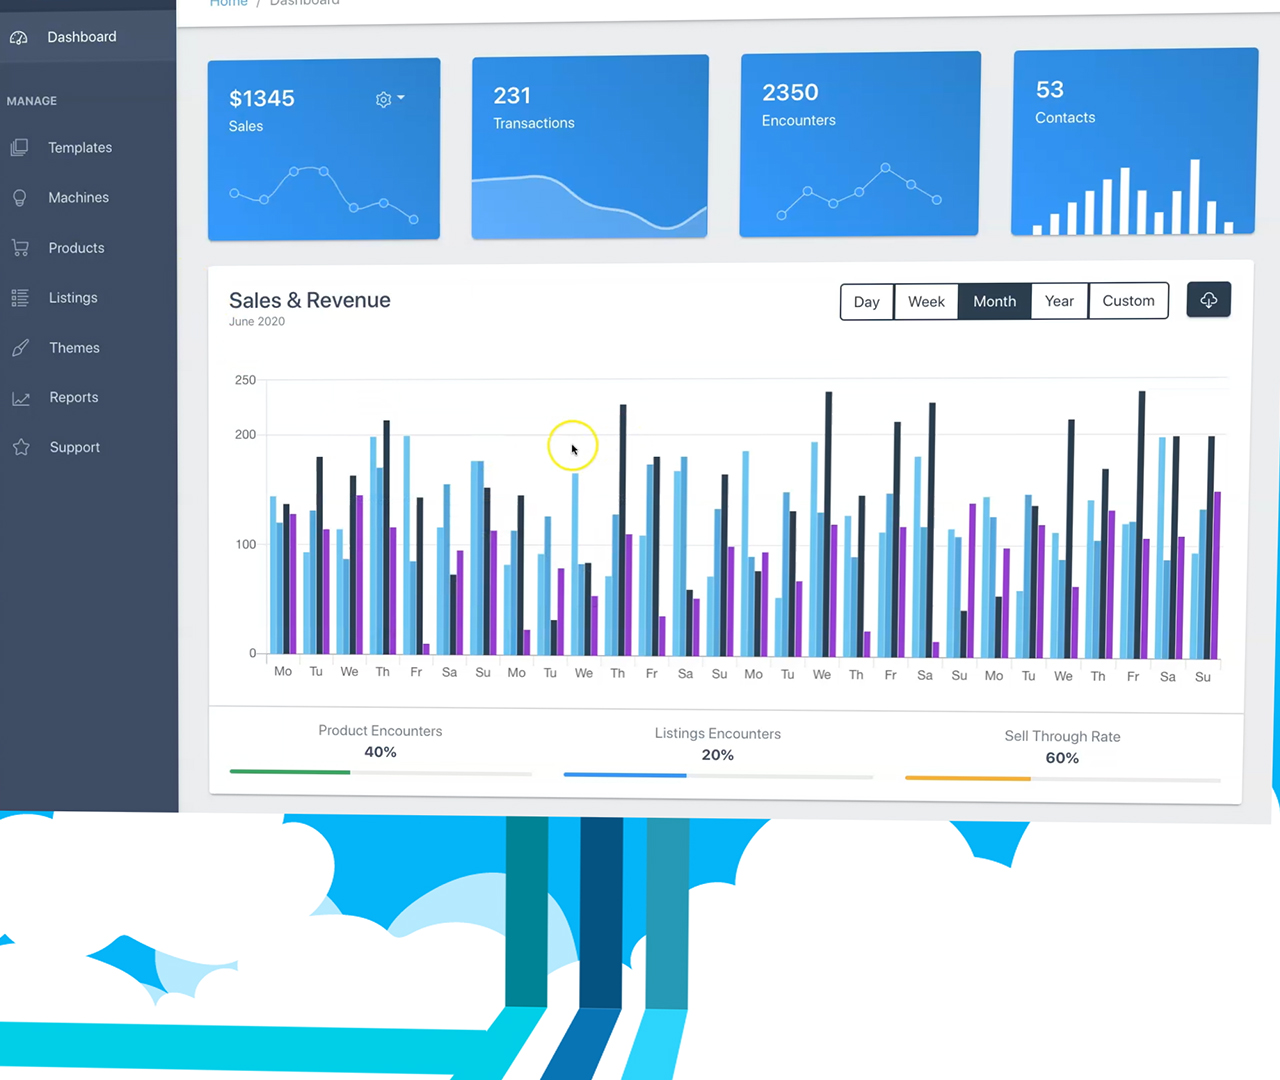
Predictive analytics uses historical behavior data to forecast future demand, helping optimize stock levels and reduce both stockouts and waste.
Predictive Analysis Strategy
Here's our approach to predictive stocking:
Predictive Framework
| Data Point | Analysis Method | Action Items |
|---|---|---|
| Historical Sales | Trend analysis | Base inventory levels |
| Weather Forecast | Correlation study | Seasonal adjustments |
| Local Events | Impact assessment | Special stock planning |
| Customer Feedback | Sentiment analysis | Product mix updates |
How do you optimize product mix based on behavior data?
Learning to read and respond to customer behavior data changed everything about our product selection strategy.
Behavior-based product mix optimization ensures your machines stock items that match customer preferences and buying patterns, maximizing sales potential.

Product Mix Optimization Strategy
Understanding and implementing behavior-based selection:
Product Selection Framework
| Behavior Pattern | Product Strategy | Expected Impact |
|---|---|---|
| High-Frequency Items | Always in stock | Consistent revenue |
| Impulse Purchases | Strategic placement | Increased sales |
| Health-Conscious | Balanced options | Broader appeal |
| Price Sensitivity | Value alternatives | Higher volume |
Customer behavior insights are crucial for optimizing vending inventory choices. By understanding peak purchase times, location-specific preferences, seasonal trends, and using predictive analytics, you can make informed decisions that boost sales and customer satisfaction. Remember to regularly analyze behavior data and adjust your strategy accordingly.